Important
- To install Prometheus package, please follow the installation guide.
- To view Prometheus package complete configuration options and their default values, please refer to the prometheus package spec.
This is the multi-page printable view of this section. Click here to print.
This tutorial demonstrates how to config the Prometheus package to scrape metrics from an EKS Anywhere cluster, and visualize them in Grafana.
This tutorial walks through the following procedures:
The Prometheus package creates two components by default:
The prometheus-server is pre-configured to scrape the following targets at 1m interval:
If no config modification is needed, a user can proceed to the Prometheus installation guide .
In this section, we cover a few frequently-asked config customizations. After determining the appropriate customization, proceed to the Prometheus installation guide to complete the package installation. Also refer to Prometheus package spec for additional config options.
By default, prometheus-server is configured with evaluation_interval: 1m, scrape_interval: 1m, scrape_timeout: 10s. Those values can be overwritten if preferred / needed.
The following config allows the user to do such customization:
apiVersion: packages.eks.amazonaws.com/v1alpha1
kind: Package
metadata:
  name: generated-prometheus
  namespace: eksa-packages-<cluster-name>
spec:
  packageName: prometheus
  server:
    global:
      evaluation_interval: "30s"
      scrape_interval: "30s"
      scrape_timeout: "15s"
By default, prometheus-server is created as a deployment with replicaCount equals to 1. If there is a need to increase the replicaCount greater than 1, a user should deploy prometheus-server as a statefulSet instead. This allows multiple prometheus-server pods to share the same data storage.
The following config allows the user to do such customization:
apiVersion: packages.eks.amazonaws.com/v1alpha1
kind: Package
metadata:
  name: generated-prometheus
  namespace: eksa-packages-<cluster-name>
spec:
  packageName: prometheus
  server:
    replicaCount: 2
    statefulSet:
      enabled: true
A user may disable the prometheus-server when:
The following config allows the user to do such customization:
    apiVersion: packages.eks.amazonaws.com/v1alpha1
    kind: Package
    metadata:
      name: generated-prometheus
      namespace: eksa-packages-<cluster-name>
    spec:
      packageName: prometheus
      server:
        enabled: false
A user may disable the node-exporter when:
The following config allows the user to do such customization:
    apiVersion: packages.eks.amazonaws.com/v1alpha1
    kind: Package
    metadata:
      name: generated-prometheus
      namespace: eksa-packages-<cluster-name>
    spec:
      packageName: prometheus
      nodeExporter:
        enabled: false
To ensure the Prometheus package is installed correctly in the cluster, a user can perform the following tests.
Port forward Prometheus to local host 9090:
export PROM_SERVER_POD_NAME=$(kubectl get pods --namespace <namespace> -l "app=prometheus,component=server" -o jsonpath="{.items[0].metadata.name")
kubectl port-forward $PROM_SERVER_POD_NAME -n <namespace> 9090
Go to http://localhost:9090 to access the web UI.
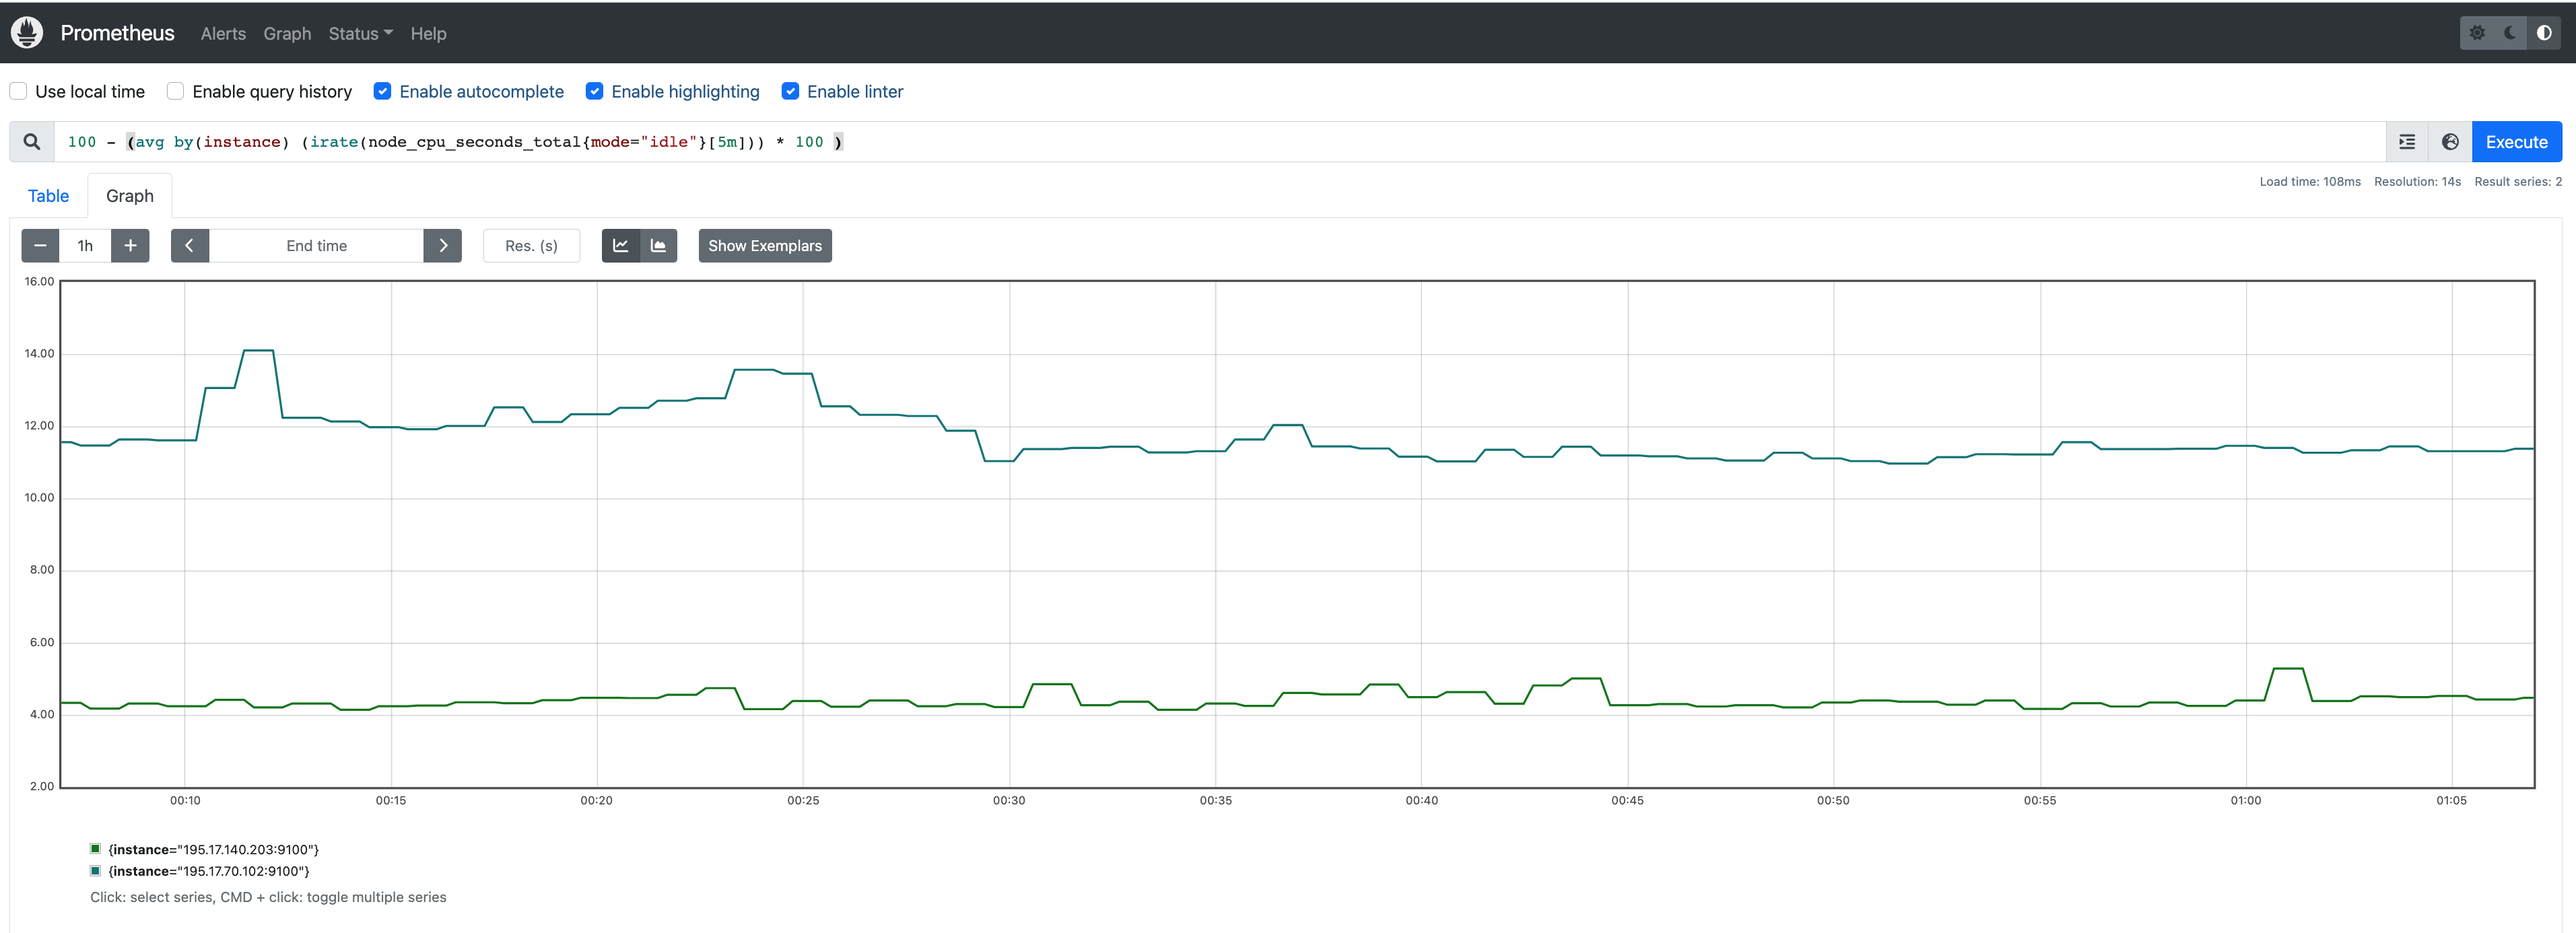
Run sample queries in Prometheus web UI to confirm the targets have been configured properly. For example, a user can run the following query to obtain the CPU utilization rate by node.
100 - (avg by(instance) (irate(node_cpu_seconds_total{mode="idle"}[5m])) * 100 )
The output will be displayed on the Graph tab.
A user can install Grafana in the cluster to visualize the Prometheus metrics. We used the Grafana helm chart as an example below, though other deployment methods are also possible.
Get helm chart repo info
helm repo add grafana https://grafana.github.io/helm-charts
helm repo update
Install the helm chart
helm install my-grafana grafana/grafana
Obtain Grafana login password:
kubectl get secret --namespace default my-grafana -o jsonpath="{.data.admin-password}" | base64 --decode; echo
Port forward Grafana to local host 3000:
export GRAFANA_POD_NAME=$(kubectl get pods --namespace default -l "app.kubernetes.io/name=grafana,app.kubernetes.io/instance=my-grafana" -o jsonpath="{.items[0].metadata.name}")
kubectl --namespace default port-forward $GRAFANA_POD_NAME 3000
Go to http://localhost:3000
to access the web UI.
Log in with username admin, and password obtained from the Obtain Grafana login password in step 1 above.
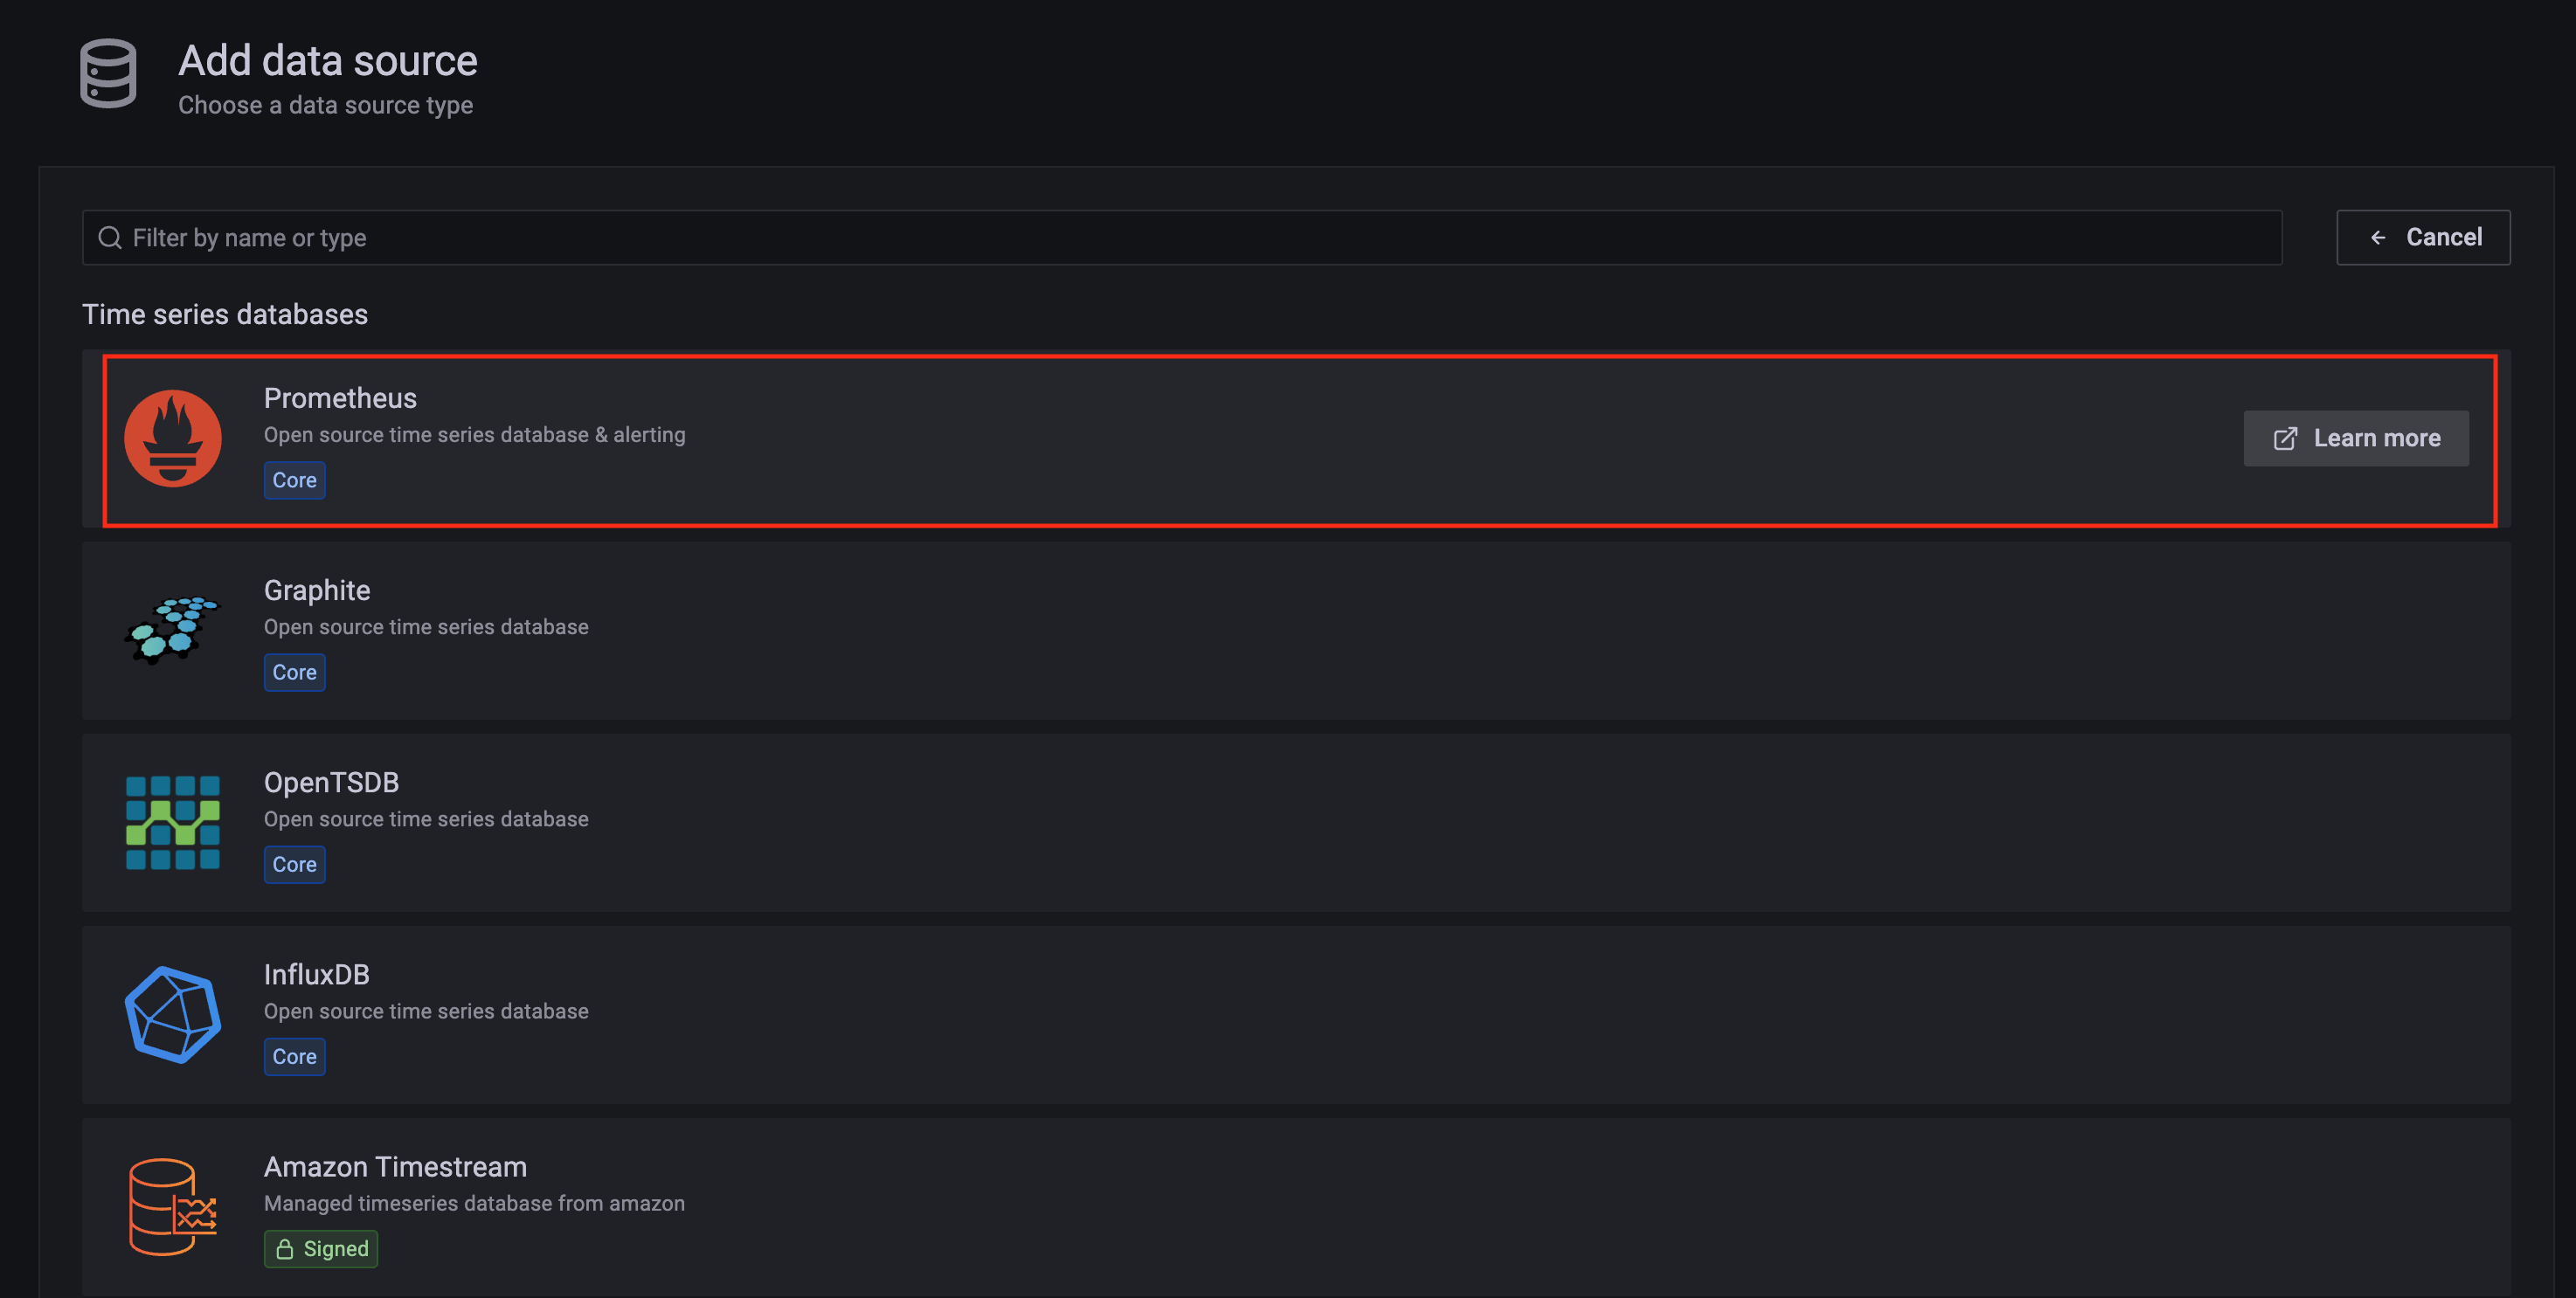
Click on the Configuration sign on the left navigation bar, select Data sources, then choose Prometheus as the Data source.
Configure Prometheus data source with the following details:
Prometheus as an example.http://<prometheus-server-end-point-name>.<namespace>:9090. If the package default values are used, this will be http://generated-prometheus-server.observability:9090.1m or the value specified by user in the package config.Save and test. A notification data source is working should be displayed.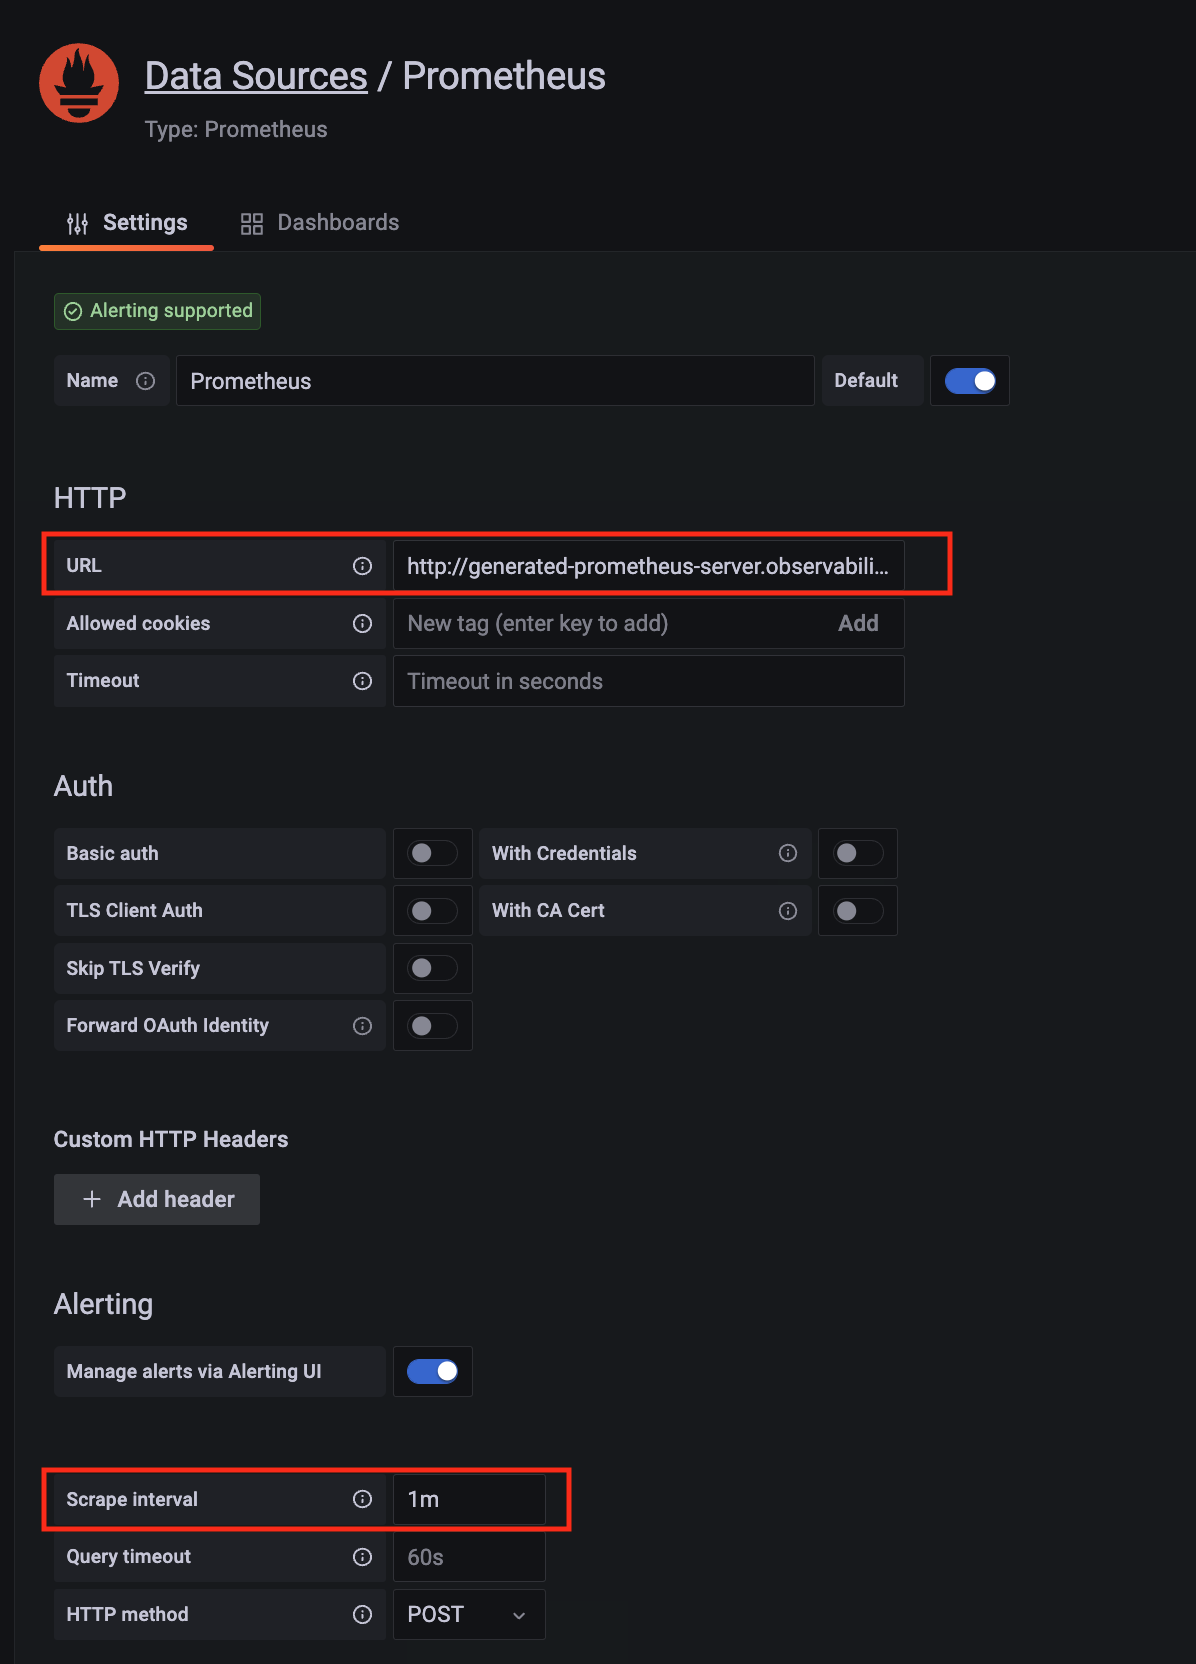
Import a dashboard template by hovering over to the Dashboard sign on the left navigation bar, and click on Import. Type 315 in the Import via grafana.com textbox and select Import.
From the dropdown at the bottom, select Prometheus and select Import.
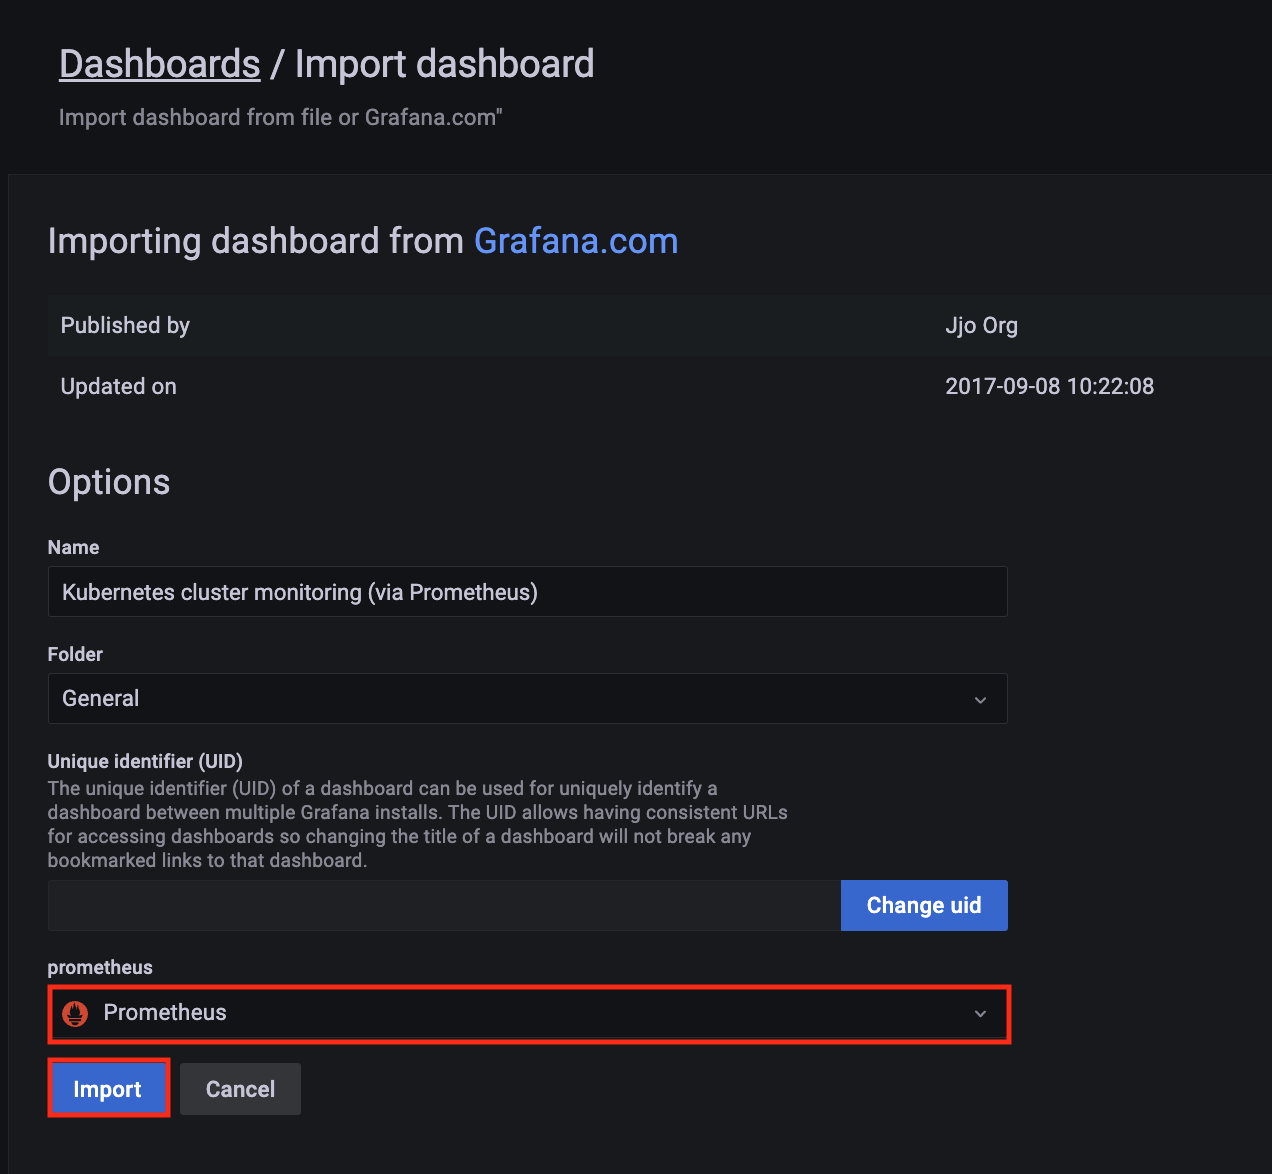
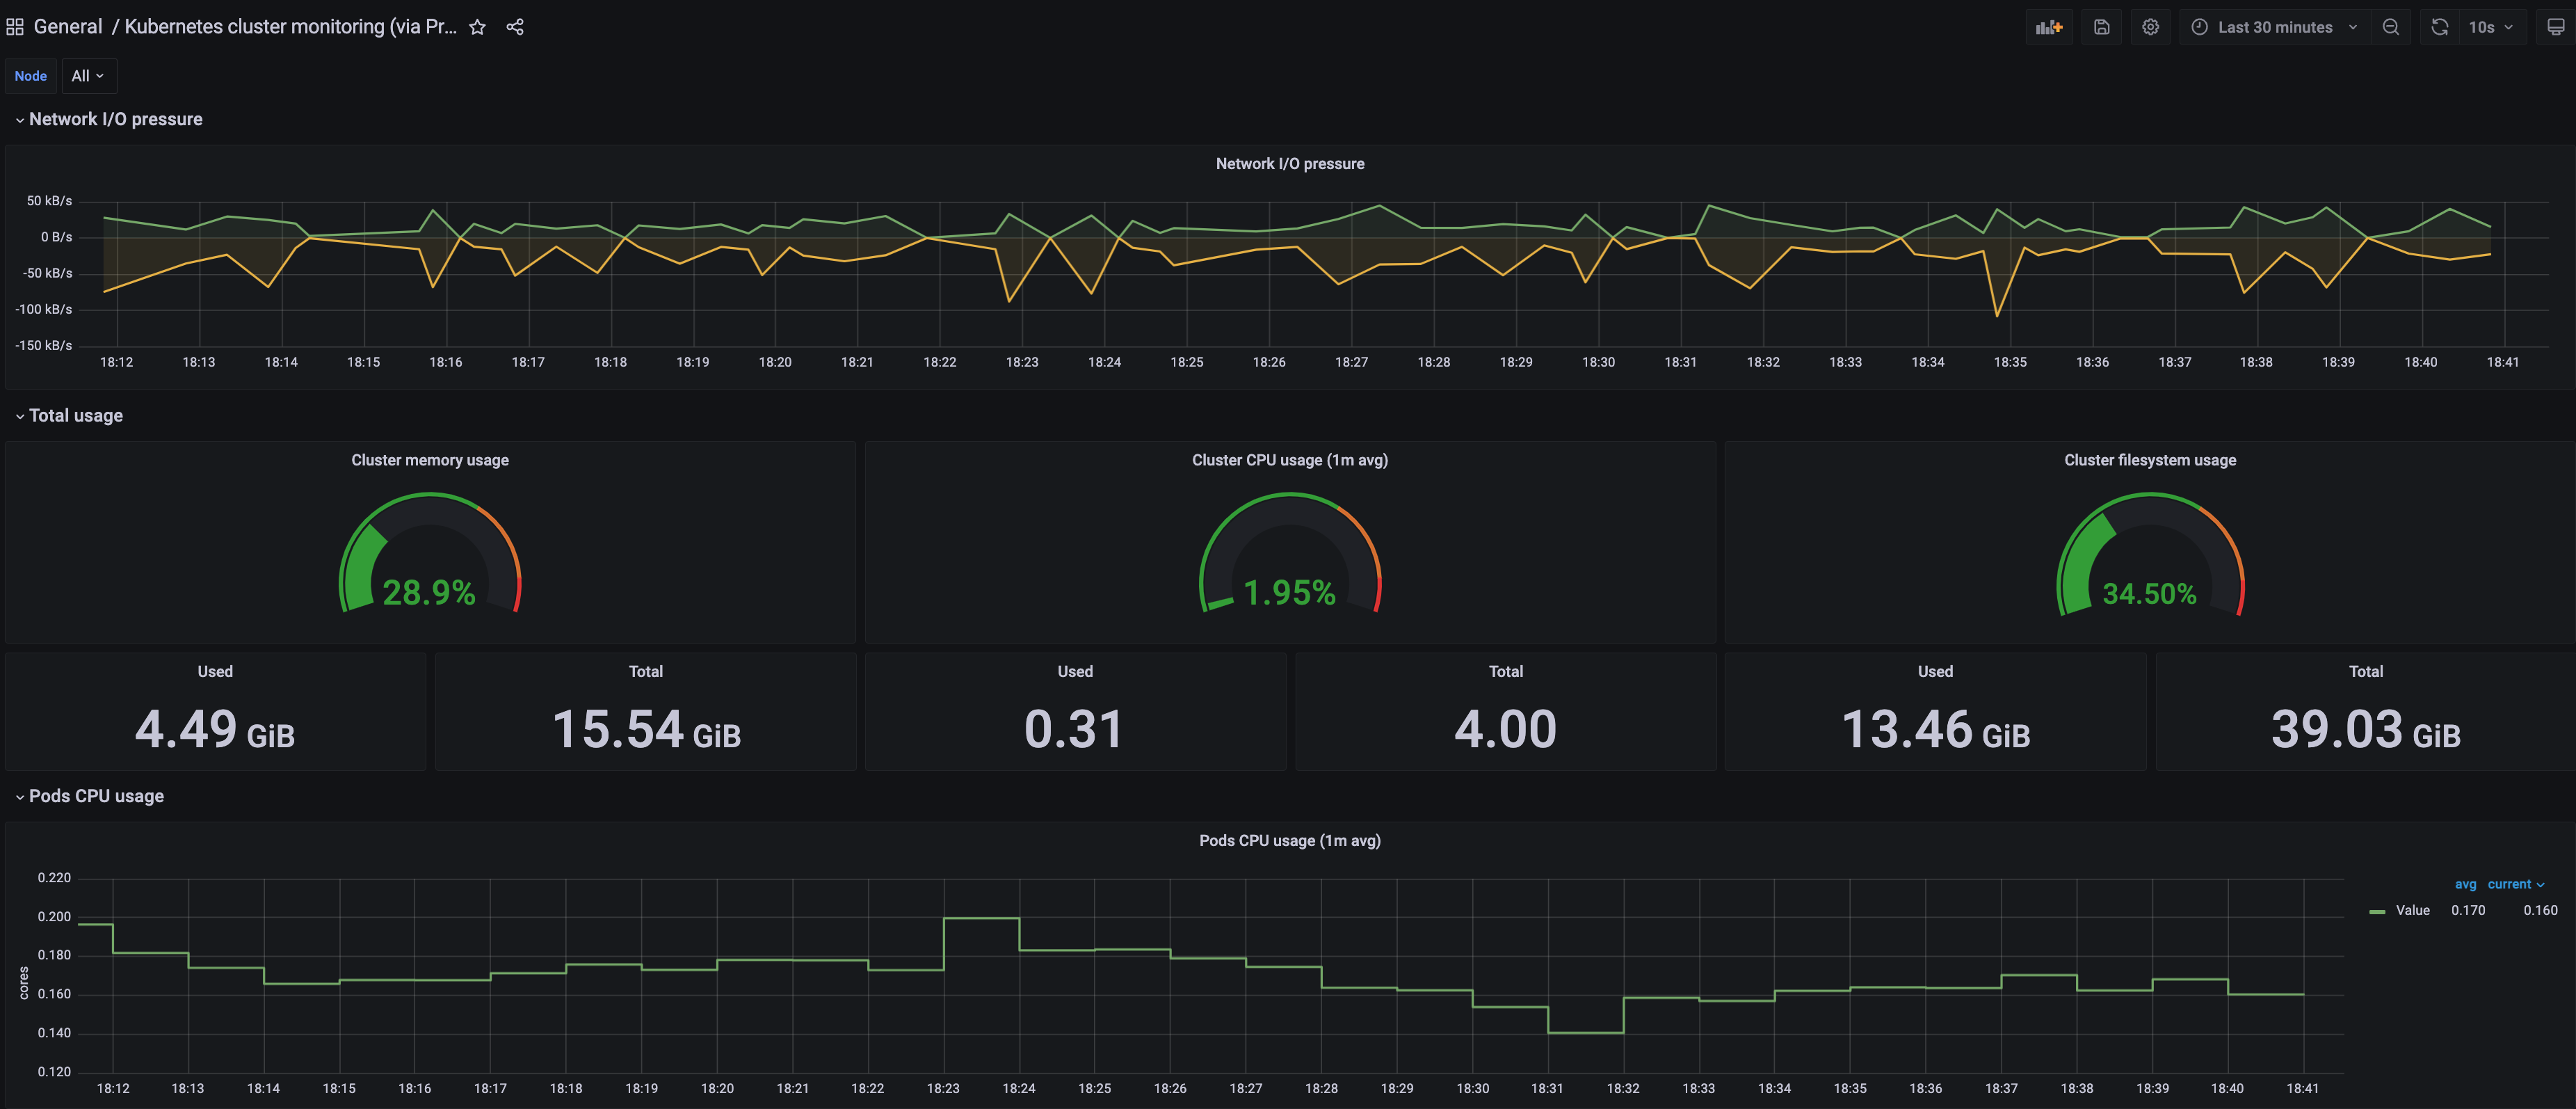
A Kubernetes cluster monitoring (via Prometheus) dashboard will be displayed.
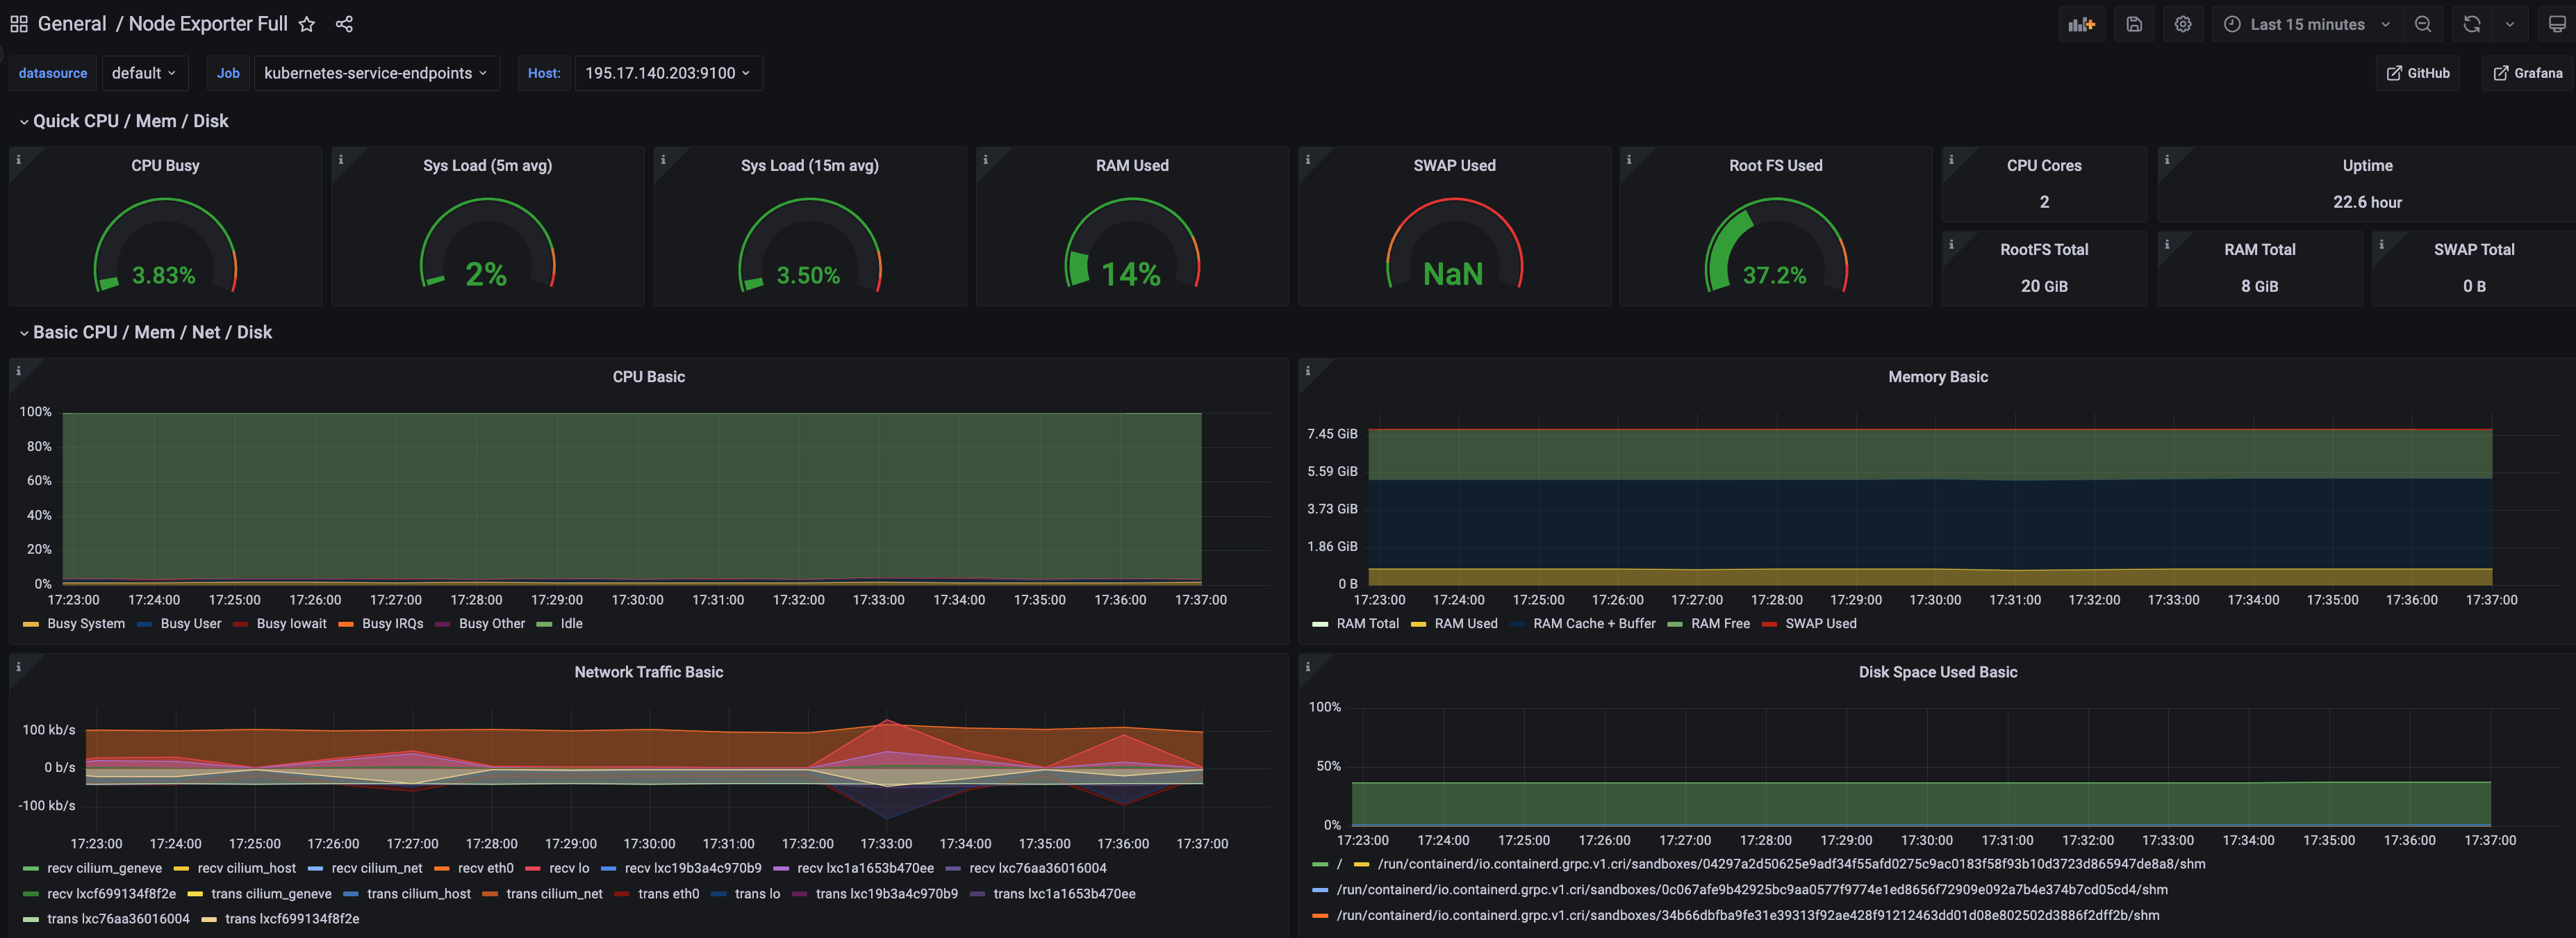
Perform the same procedure for template 1860. A Node Exporter Full dashboard will be displayed.